Analytics Dashboard
The Analytics Dashboards are designed to provide you with deep insights and a comprehensive view of your data, enabling more informed decision-making and strategic planning.
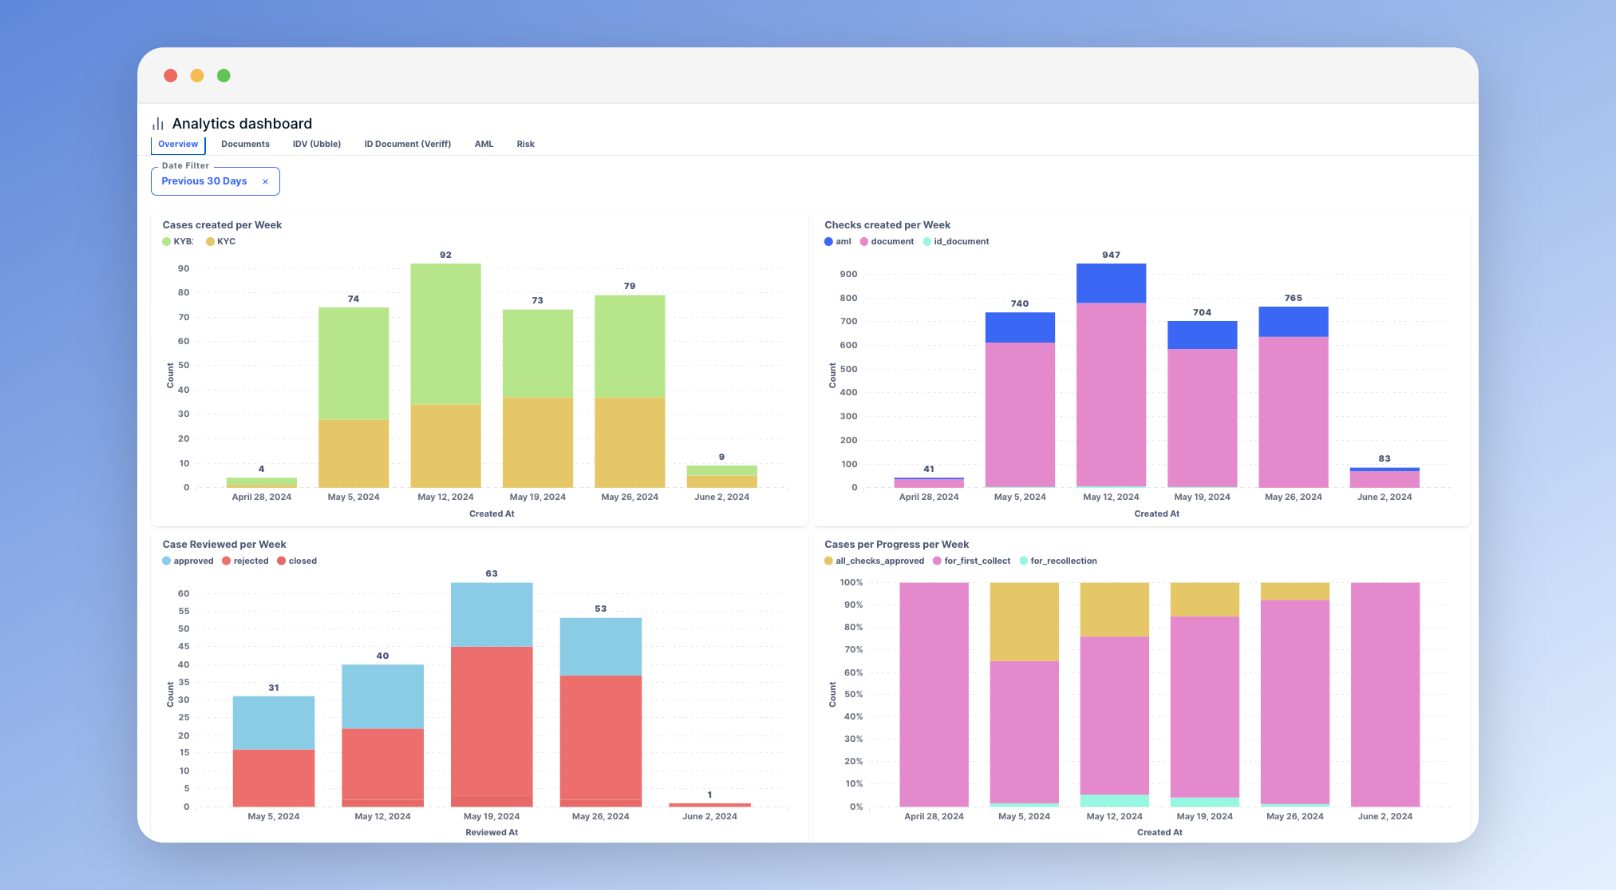
Key Features:
- Interactive Visualizations: Explore your data with dynamic charts, graphs, and tables.
- Real-Time Data Updates: Access the latest data with live updates to stay on top of trends and changes.
- Filtering Options: Filter your data by date to analyze trends over specific time periods.
- Comprehensive Cases Overview: Get a complete overview of your cases data, ensuring you never miss critical information.
- Dedicated Tabs for Different Checks and Risk Scoring: Navigate through various checks and risk scoring metrics with dedicated tabs for a streamlined experience.
- Downloadable data: Download the data from each charts.
Updated 11 months ago
Did this page help you?